

Introduction:
Like people, governments may borrow money to manage their economies, finance budget deficits or capital projects, or meet the balance of payments or cost of national emergencies. The World Bank is an international financial institution that provides loans and grants to the governments of low- and middle-income countries to pursue capital projects (World Bank, 2008).
This project uses SQL and Microsoft PowerBI to analyze international debt data collected by The World Bank. The dataset contains information about the amount of debt (in USD) owed by developing countries across several categories.
The report provides an exposition on:
- The total amount of debt owed by the countries listed
- Countries with the highest and lowest debt (in USD)
- The average amount of debt owed by countries across different debt indicators
- Debt owed by all countries listed
Data and Model:
i) SQL
The first line of code was to connect to the international_debt database where the table 'international_debt' resides. All columns were selected but limited to 10 rows to keep the output clean.
postgresql:///international_debt
  SELECT *
  FROM international_debt
  LIMIT 10;
Number of distinct countries:
SELECT COUNT (DISTINCT country_name) AS total_distinct_countries
FROM international_debt;
Distinct debt indicators:
SELECT DISTINCT indicator_code AS distinct_debt_indicators
FROM international_debt
ORDER BY distinct_debt_indicators;
Sum of debts/1000000 in two decimal places:
SELECT CAST (SUM(debt)/1000000 as decimal (9,2)) AS total_debt
FROM international_debt;
Country with the highest debt:
SELECT country_name, SUM(debt) AS total_debt
FROM international_debt
GROUP BY country_name
ORDER BY total_debt DESC
LIMIT 1;
Average amount of debt across debt indicators:
SELECT indicator_code AS debt_indicator, indicator_name, AVG(debt) AS average_debt
FROM international_debt
GROUP BY debt_indicator, indicator_name
ORDER BY average_debt DESC
LIMIT 10;
The highest amount of principal repayments:
SELECT country_name, indicator_name
FROM international_debt
WHERE debt = (SELECT MAX(debt)
            FROM international_debt
            WHERE indicator_code='DT.AMT.DLXF.CD');
The most common debt indicator:
SELECT indicator_code, COUNT(indicator_code) AS indicator_count
FROM international_debt
GROUP BY indicator_code
ORDER BY indicator_count DESC, indicator_code DESC
LIMIT 20;
ii) Power BI
The CSV file was loaded into the power query editor. An index column was added through the 'add column tab'. The data was then loaded into Power BI.
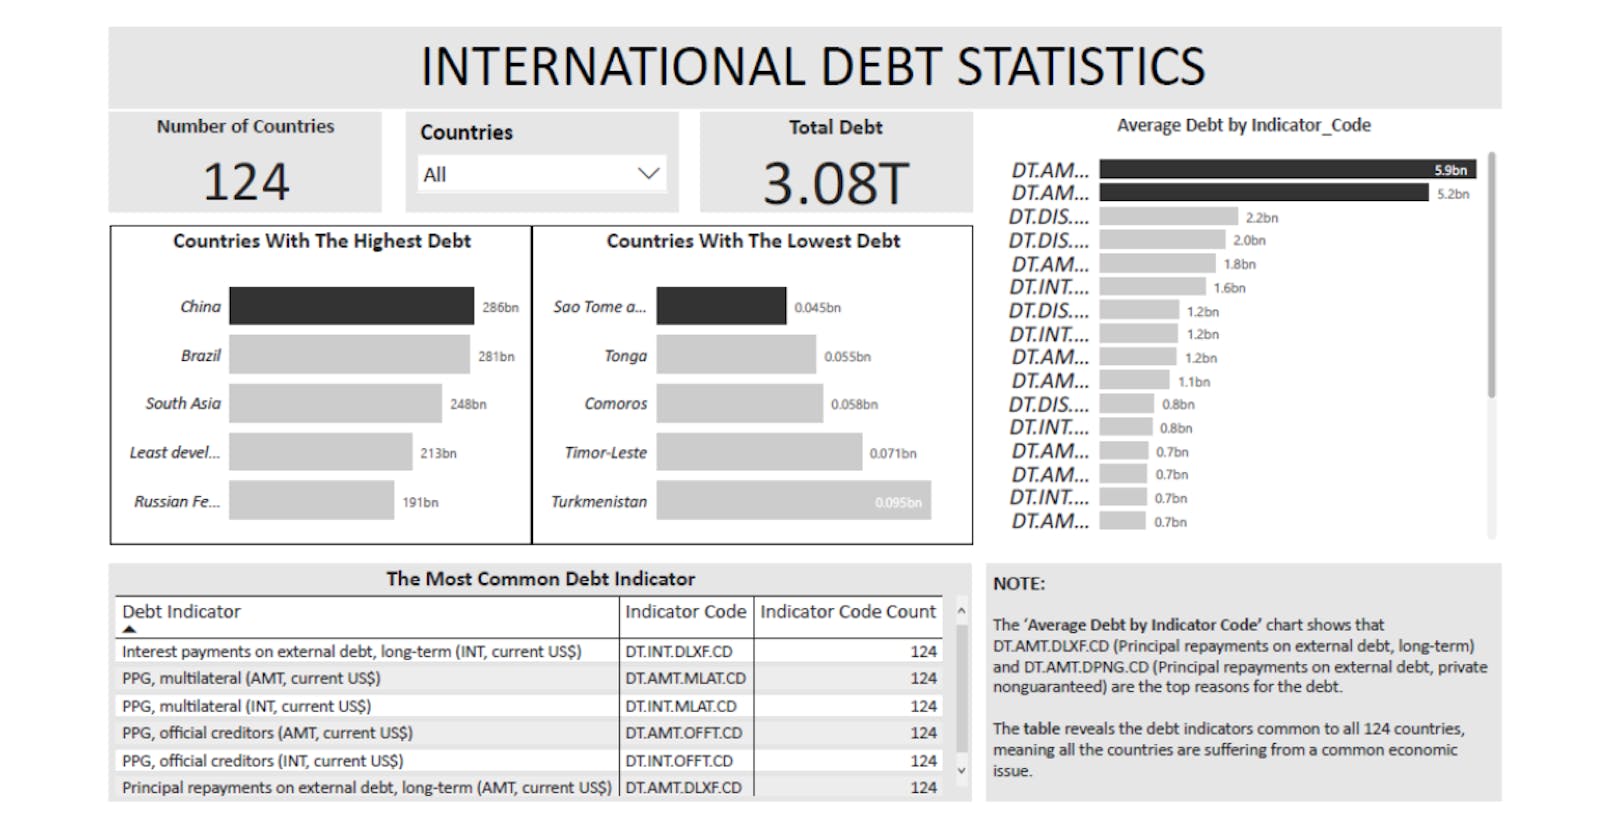
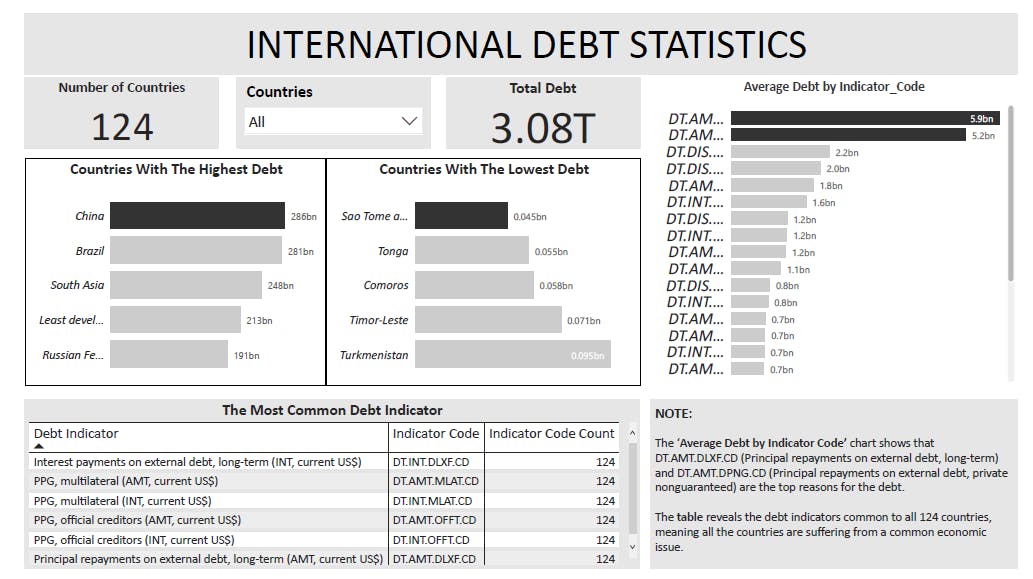
- The number of distinct countries: Presented on a card to show the distinct country count and a slicer was added.
Sum of debts: Presented on a card, representing the total of the debt column
Countries with the highest and lowest debt: Presented on the stacked bar chart. Filter was applied to show the top & bottom N (5) countries.
The average amount of debt across indicators: Presented on the bar chart with the X-axis showing the calculated average debt.
The most common debt indicator: The number of times the debt indicators span across the countries was calculated. The debt indicators equal to '124', were displayed in a table.
Result:
Click here or the picture to interact with the dashboard.
Conclusion:
Principal repayments on external debt, long-term (AMT, current US$) and Principal repayments on external debt, private nonguaranteed (PNG) (AMT, current US$) were the top reasons the countries borrow from the World Bank.
After these two, there is a significant difference in the amount of debt in the debt indicators. China has the highest debt in the long-term debt Principal repayments on external debt, long-term (AMT, current US$) (DT.AMT.DLXF.CD) category.
Six debt indicators were common to all 124 countries, indicating that all countries suffer from common economic issues.
China, Brazil, South Asia, and Russian Federation had the highest debt.
Sao Tome and Principe, Tonga, Comoros, Timor-Leste, and Turkmenistan had the least debt.